Eliminate SEO Friction — and Soar!
Right then, let’s be frank, shall we? Most SEO specialists are still stuck somewhere back in 2019 😉 They’re still chasing metrics, crafting “perfectly optimised” copy that nobody reads to the end, and reckon the main goal is getting a site to the top. Though the top position itself delivers nothing.
The key shift is that people land on websites but don’t convert. Because there are far too many losses on the path to conversion.
What Are These Losses and Why Do They Kill Conversions?
Losses in SEO are everything that forces users to expend additional effort. Every unnecessary click, pointless scroll, unclear wording, slow loading time — all of this is friction 🤮
We at PERFORMIQ examined statistics from 24 projects over the past year and discovered that:
- On average, a user makes 7 clicks from search query to placing an order
- 61% of users abandon the journey at the third click
- Websites with “perfect” SEO optimisation often have conversion rates 40% lower than sites with user-friendly UX
Moreover, Google itself has evolved towards combating losses: Core Web Vitals, E-A-T, algorithms penalising pages with similar content — all these are signs that the search engine wants users to find what they’re looking for more quickly.
Main Loss Points We’ve Identified in Projects
After analysing user behaviour on our clients’ websites (with their permission, naturally), we’ve identified several typical pain points:
- Critical Conversion Barriers in Digital Funnels: Technical Support for Customer Journey
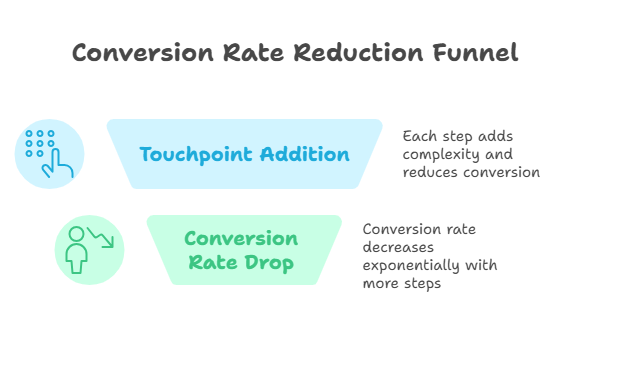
Excessive conversion path length with UX optimisation principle violations. Each additional touchpoint between SERP click and target action exponentially reduces conversion rate according to attribution models. Heat map analysis and session recordings demonstrate the critical importance of minimising steps to conversion 🚀
2. Overcomplicated filtration taxonomy without regard for users’ mental models. Multi-level faceted search systems with native industry terminology instead of user-friendly labels create cognitive load that increases bounce rates. The optimal solution is progressive information disclosure with preset popular filters.
3. Content hub strategy without integration with sales funnel architecture. Informational pages lacking internal linking strategy to commercial pages and absence of calls-to-action with lead magnets turn organic traffic into dead-end sessions. SEO content must work through mapping from content to commerce.
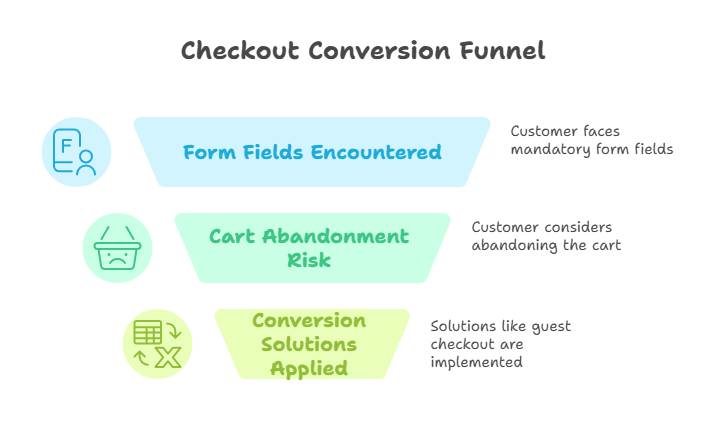
4. Frictional checkout flow with excessive form fields. Cart abandonment percentage grows proportionally to the number of mandatory fields. Best solutions include guest checkout, autocomplete integration, progressive profiling, and one-click purchasing for returning users.
5. Responsive design with cross-device user experience consistency violations. Mobile-first approach requires unified navigational patterns and identical information architecture across all device breakpoints. Adaptive content hiding creates gaps in customer journey mapping between desktop and mobile touchpoints.
Methodology for Identifying SEO Barriers
I’ll say this straight away — GA data doesn’t provide the complete picture. It shows what happens, but not why. For comprehensive friction analysis, we employ an integrated approach:
- Heat maps + session recordings. We use Hotjar and ClickTale to see where users click, how far they scroll, and where they hesitate.
- SEO traffic segmentation. We divide traffic into micro-segments: by queries, devices, demographics, and analyse each segment’s behaviour separately.
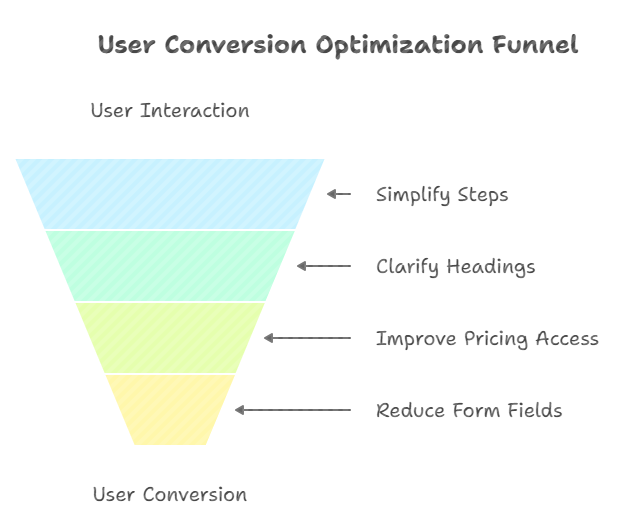
- Friction point checklist. We’ve developed our own list of 10 key questions that helps identify most problems:
- How many steps must a user take from first interaction to conversion?
- Which steps can be combined or removed?
- Are headings and calls-to-action clear without context?
- How quickly can users find pricing?
- Are we requesting superfluous information in forms?
- etc.
Let’s be honest — most clients couldn’t care less about UX and barriers. They want to see figures and ROI. Here’s how we translate “friction reduction” into business-understandable metrics:
- Potential benefit formula:
Additional profit = Current traffic × (Current conversion × Growth coefficient − Current conversion) × Average order value
Example: If a site has 10,000 monthly visitors, 2% conversion, £5,000 average order value, and friction reduction could increase conversion by 1.5 times:
10,000 × (2% × 1.5 − 2%) × £5,000 = £500,000 additional revenue
2. Customer journey visualisation. We create schemes showing how many people are lost at each funnel stage due to friction, and how much money this costs the business.
3. A/B tests on small samples. We conduct rapid tests on small traffic segments to demonstrate friction reduction effects in miniature.
What to Do Right Now: Quick Ways to Reduce Friction
If you want to begin working on barrier reduction immediately, here are several quick measures that deliver maximum effect with minimal effort:
- Comprehensive entry point audit with conversion path mapping analysis. Conduct deep analysis of top-10 landing pages through Google Analytics 4 Enhanced Ecommerce and Hotjar behavioural analytics. Calculate conversion step coefficients for each traffic source and segment. Apply funnel analysis methodology with critical dropout point identification and user flow optimisation through A/B testing various navigational patterns.
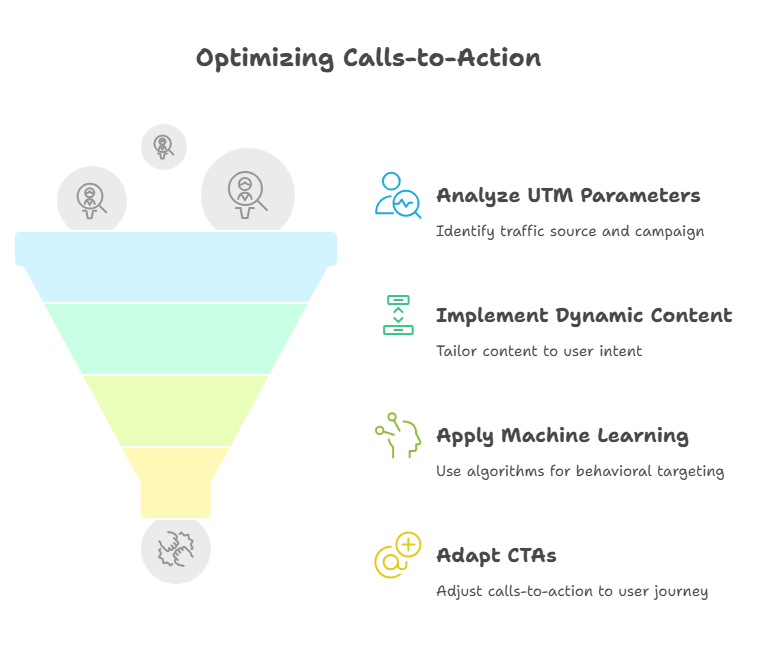
- Dynamic call-to-action testing using intent-based personalisation. Implement dynamic content optimisation based on search query analysis and UTM parameters. Modern high-performance solutions include behavioural targeting through machine learning algorithms, where CTAs adapt to user journey stages. Instead of static calls-to-action, use contextual messages with urgency triggers and value propositions based on source/channel attribution.
- Form optimisation using progressive profiling. Implement UX form optimisation principles: conditional logic for adaptive fields, real-time validation, and intelligent default values. Each additional field reduces form completion rates by 6–8% according to conversion optimisation best practices. Multi-step forms with progress indicators are recommended for complex lead generation scenarios.
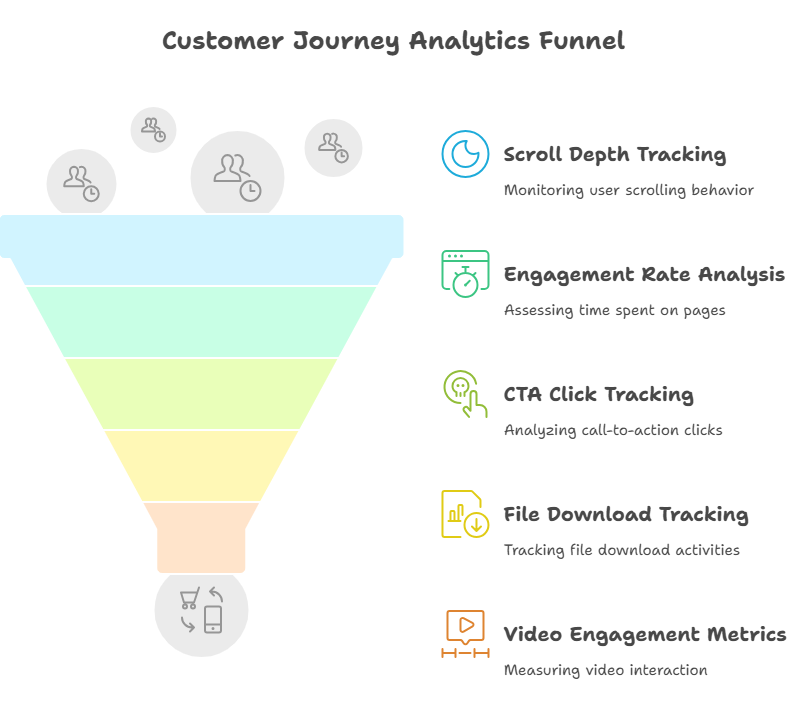
- Advanced event tracking and micro-conversion analytics setup. Configure Enhanced Measurement in GA4 with custom events for all key interactions: scroll depth tracking (25%, 50%, 75%, 100%), engagement rate by time on page, CTA element click tracking, file downloads, video engagement metrics. Integrate with conversion attribution models for complete understanding of customer journey from awareness to purchase.
The New SEO Paradigm
Let’s summarise. Top rankings in search results are only half the battle. SEO without conversion optimisation is a waste of money and time.
At PERFORMIQ, we’ve followed the principle “first eliminate friction, then scale traffic” for the past two years. Because what’s the point of pouring water into a leaky bucket? 🚀
We’ve stopped telling clients about “improving positions”. Instead, we discuss “increasing organic conversion flow”. And this completely transforms our approach to work.
Drop us a line if you have any questions.